Carbon Reporting, our Platform and Dashboards
Managing carbon data across sites, suppliers and energy bills is difficult when information sits across multiple spreadsheets.
As reporting expectations grow, businesses need a clearer way to measure emissions, track progress and report with confidence.
So, we combine the right platform with hands-on delivery to produce accurate outputs without adding pressure to internal teams.
What is a Carbon Reporting Platform?
A carbon reporting platform is a digital system used to collect, organise and calculate greenhouse gas emissions. It replaces disconnected spreadsheets and manual processes with a more reliable and efficient approach.
It helps businesses measure Scope 1, 2 and 3 emissions, monitor changes over time and produce reports for customers, investors and internal stakeholders.
What Information does it Assess?
A strong carbon tracking system should assess the main sources of business emissions, including:
- Gas, fuels and company vehicles
- Purchased electricity
- Refrigerants and heating systems
- Business travel and employee commuting
- Waste and water use
- Purchased goods and services
- Freight and logistics
- Supplier and supply chain activity
- Multi-site operational data
The aim is to build a complete picture of emissions without making data collection harder than it needs to be.
What Outputs does it Give?
A well-managed carbon reporting dashboard should provide clear and usable outputs, including:
- Scope 1, 2 and 3 emissions totals
- Monthly and annual trends
- Site and department comparisons
- Carbon intensity metrics
- Hotspot analysis
- Reduction opportunity tracking
- Supplier emissions summaries
- Evidence for audits and disclosures
- Exportable reports for customers and tenders
Good outputs save time, improve confidence and support action.
Why Businesses Need a Carbon Reporting Platform
More businesses are being asked to provide carbon data by customers, investors and procurement teams. Internal sustainability targets are also becoming more common. Manual reporting often cannot keep pace.
A Carbon Emissions Reporting Platform helps businesses stay in control as expectations increase.
Better Control and Data
When data sits across invoices, spreadsheets and departments, errors and gaps are common.
A platform creates one source of truth. It improves consistency, reduces duplication and makes year-on-year reporting easier. That means less time chasing figures and more confidence in the results.
Faster Decisions and Measurable Progress
Carbon data only has value when it leads to action.
A platform helps identify high-emission activities, rising energy use and supplier risks early. This allows businesses to prioritise practical improvements, reduce waste and show measurable progress.
Our Carbon Emissions Platform Choice
There are many tools in the market. Some are overcomplicated. Others look good but rely heavily on internal resource to make them work.
We focus on solutions that are practical, transparent and suited to medium sized UK businesses.
Why we have selected Climatise
We use Climatise.com because it combines strong technical capability with practical usability.
It gives clear dashboards, structured data handling and flexible reporting outputs. It also supports supplier engagement and Scope 3 analysis, which is increasingly important for clients facing customer requests.
Most importantly, it works well in real business settings where time and internal resource are limited.
The Climatise Platform
Changing Footprint has partnered with Climatise to bring clients best-in-class reporting software.
Year-round access to your carbon data, live dashboards, and audit-ready reports. Changing Footprint handles the complexity — you get the clarity.
Four capabilities. Always accessible.
Log in any time to see your emissions data, track progress, and explore insights — all in one place.
Visibility
See your emissions data live, any time — no waiting for reports.
Analytics
Understand your footprint with powerful insights and drill-downs.
Reduce
Track progress against your reduction targets and initiatives.
Engage
Collaborate with suppliers on Scope 3 data and reductions.
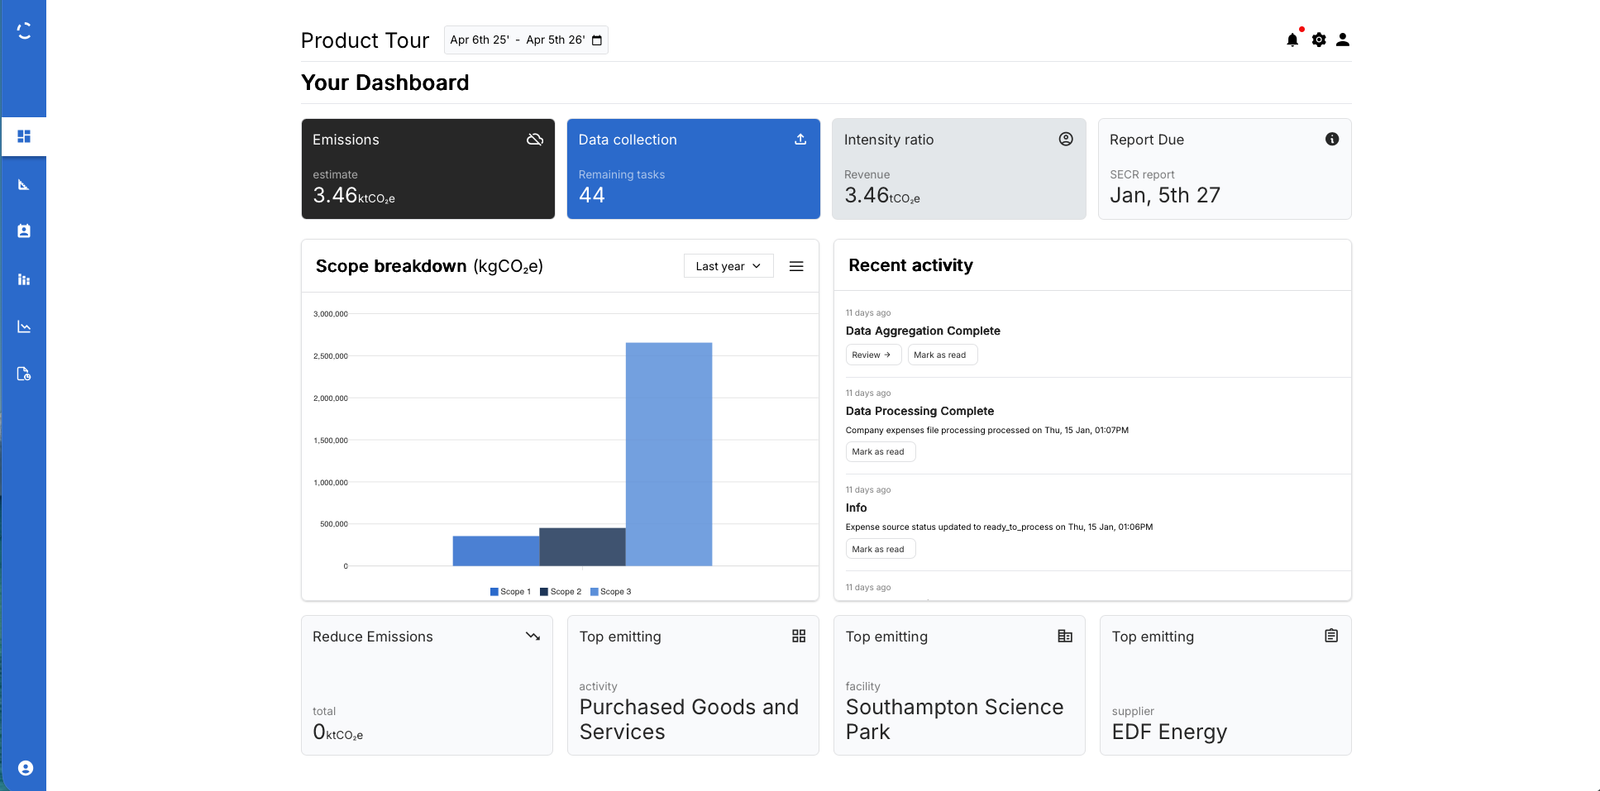
Live access to your carbon data. Year-round.
Your complete emissions dashboard is always accessible. See real-time updates as your consultant uploads new data — no more waiting for quarterly or annual reports.
- Access your complete emissions dashboard 24/7
- See real-time updates as new data is uploaded
- Share access with colleagues across your organisation
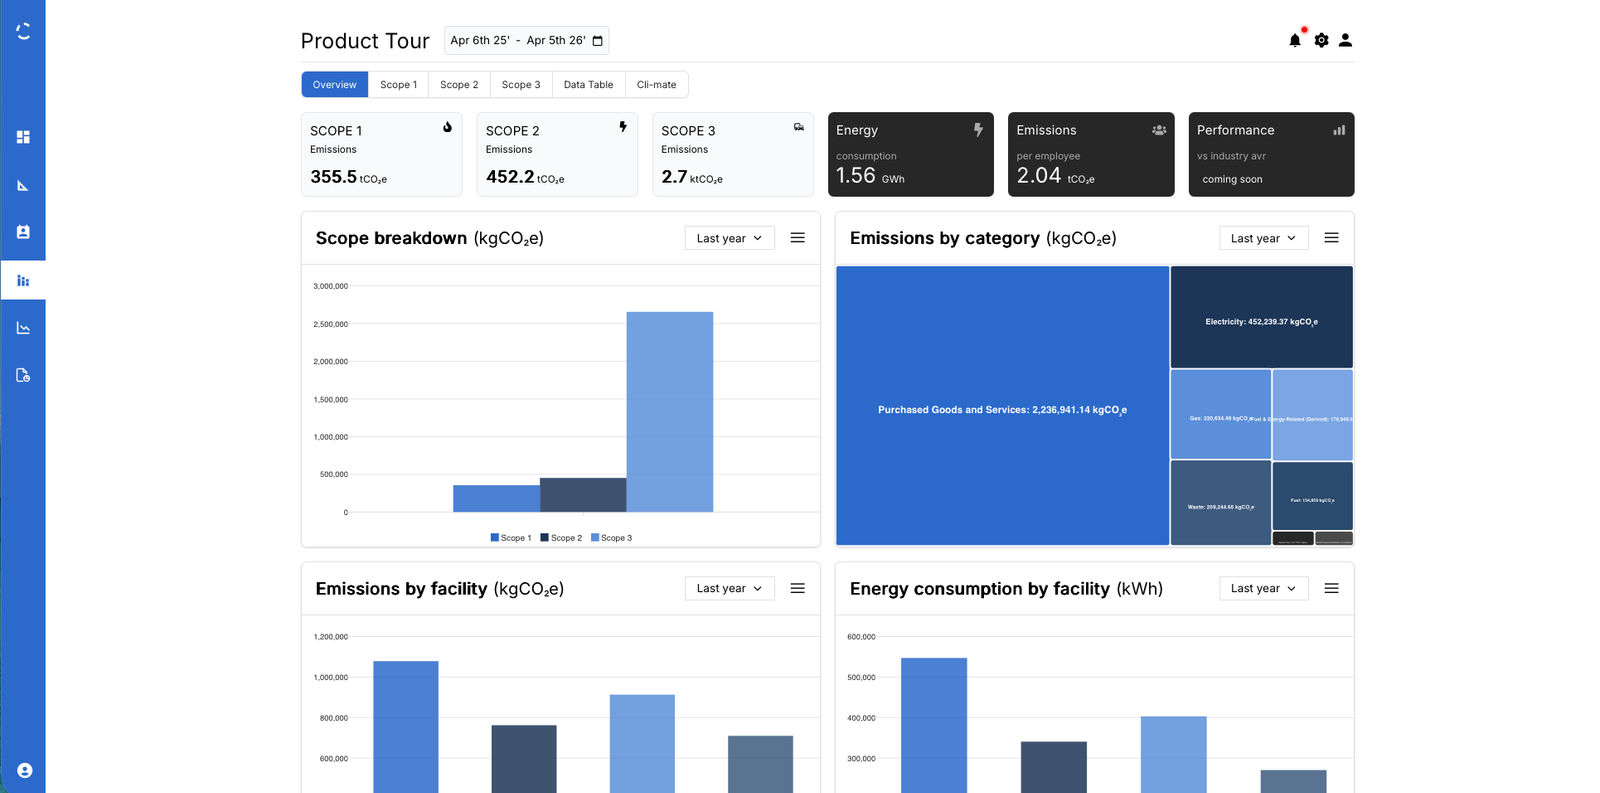
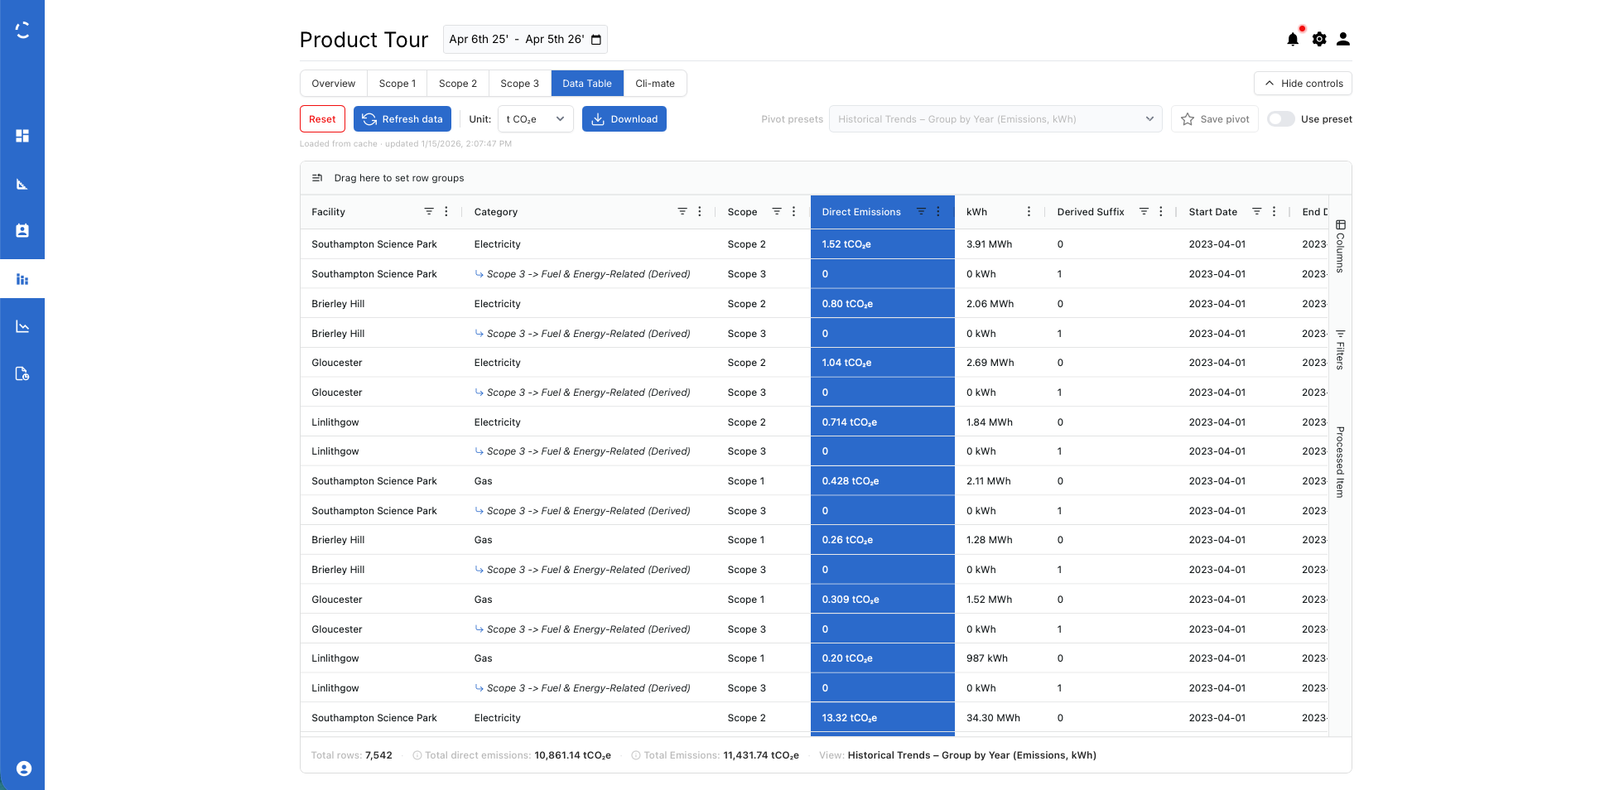
Understand exactly where your emissions come from.
Drill down by scope, category, facility, or supplier. Interactive charts and customisable views bring your carbon data to life — with full calculation transparency.
- Drill down by scope, category, facility, or supplier
- Full calculation transparency with audit trails
- Interactive charts and customisable date ranges
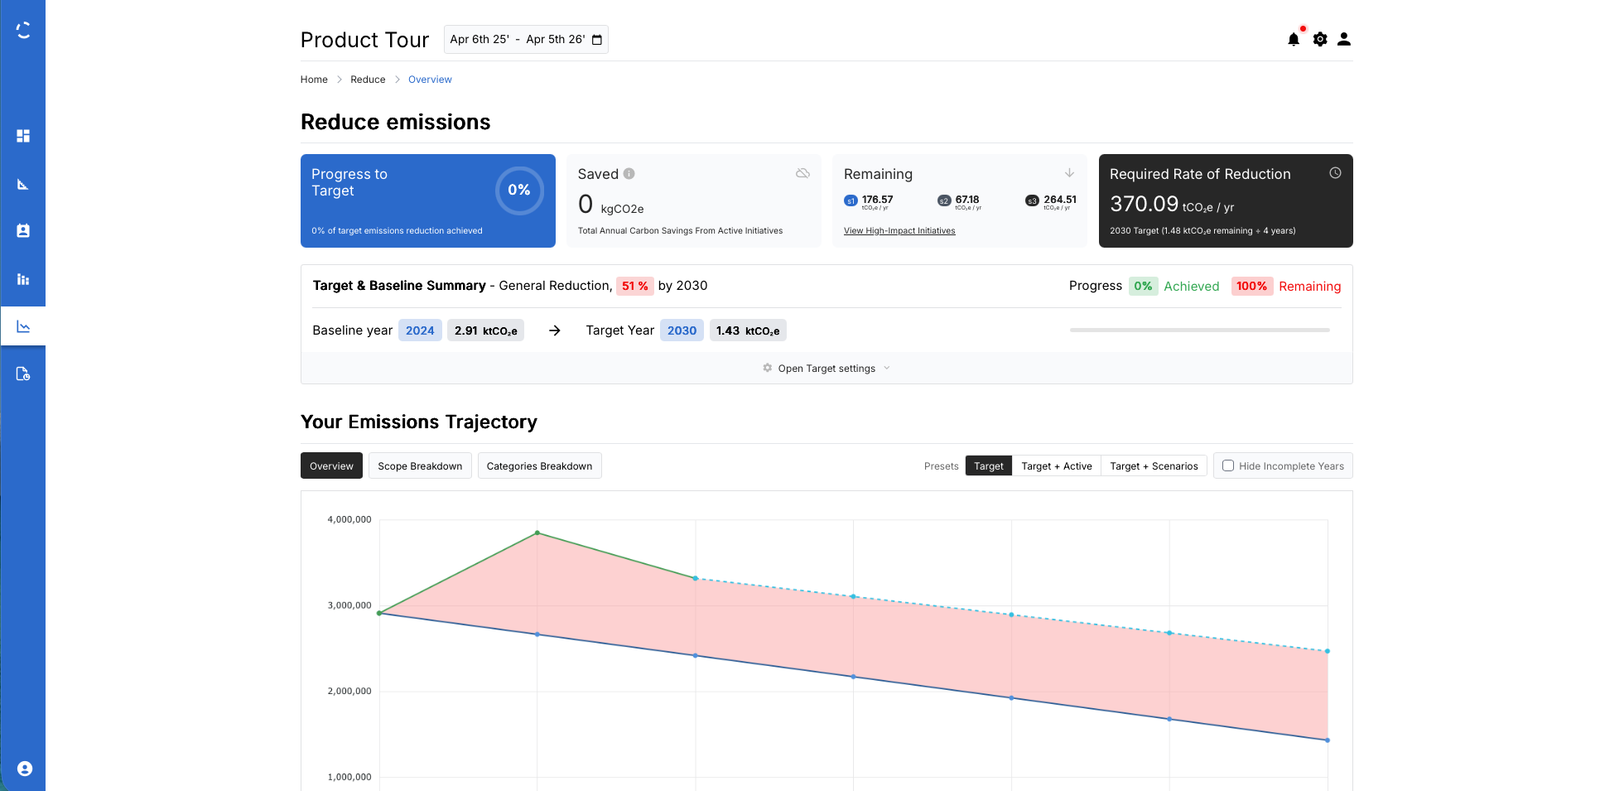
Track progress. Hit your targets.
Set reduction targets and monitor progress in real time. See which initiatives are delivering results, and model scenarios to plan your decarbonisation pathway.
- Set reduction targets and monitor progress in real time
- See which initiatives are delivering results
- Model scenarios to plan your decarbonisation pathway
Get visibility into your supply chain emissions.
See Scope 3 supplier emissions at a glance. Track supplier engagement and data quality, and identify hotspots to prioritise outreach.
- See Scope 3 supplier emissions at a glance
- Track supplier engagement and data quality
- Identify hotspots and prioritise outreach
Everything you need. Always accessible.
Year-Round Access
Log in any time to see your latest emissions data. No waiting for reports.
Interactive Dashboards
Visual dashboards that bring your carbon data to life with charts and insights.
Reduction Tracking
Set targets, track initiatives, and monitor progress towards your goals.
Supplier Engagement
Collaborate with suppliers directly. Drive supply chain transparency and reductions.
Role-Based Access
Share access with colleagues across your organisation. Everyone sees what they need.
Natural Language Chat
Ask questions in plain language. Get clear, actionable answers about your data.
How we use Climatise
We Enter the Data for You
Many clients do not have spare capacity for monthly uploads and data cleansing.
We can manage data collection, validation and entry on your behalf. That keeps reporting moving and reduces pressure on internal teams.
We Explain Hotspots and Opportunities
Dashboards are useful when the findings are clear.
We review results with you, identify emission hotspots and prioritise sensible next steps. This may include energy reduction, fleet changes, travel policy updates or supplier engagement.
We Summarise for Reporting
Different audiences need different outputs.
We prepare clear summaries for board updates, tenders, customer questionnaires, SECR, ESG disclosures and internal progress reviews.
We Train your Teams
Where clients want to build internal ownership, we provide practical training.
We show teams how to gather data, use dashboards and understand results so capability grows over time.
FAQs
Do we need a carbon platform if we already use spreadsheets?
Spreadsheets can work at a basic level, but they often become slow, inconsistent and difficult to manage as reporting grows. A platform improves control, traceability and efficiency.
Can you manage the platform for us?
Yes. Many clients ask us to run the process, from data collection to reporting outputs. This gives progress without needing a dedicated internal resource.
Is it suitable for Scope 3 reporting?
Yes. Scope 3 is often the most complex area. A structured platform helps with supplier data, estimates and supply chain emissions tracking.
How quickly can we get started?
Usually quickly. Once we understand your business structure and available data, we can build a practical reporting process and start producing results in a sensible timeframe.